My Projects
Interactive dashboards crafted for clear business insights.
Severe Seasonality
Sales grew by 24%, but "Average Sales per Order" steadily declined. The company is relying on heavy discounting to inflate revenue, sacrificing profit margins.
Superstore Sales Strategy Analysis
The Challenge: The dataset only contained top-line revenue—no costs, no unit prices, no quantities. Most analysts would build a simple descriptive dashboard. Instead, I used custom DAX proxy metrics to reverse-engineer the company's hidden operational strategies.
Margin Squeeze
Stagnant Acquisition
Despite offering 1,500+ products, the customer base grew by less than 10% over 3 years. The marketing pipeline is severely bottlenecked; they are only selling to existing clients.
Sales peak heavily in Q4 but completely collapse every February. This raises serious red flags about the ROI and timing of their annual marketing campaigns.
Conclusion: Top-line growth is masking an unsustainable strategy. The company is not acquiring market share; it is squeezing its existing base.
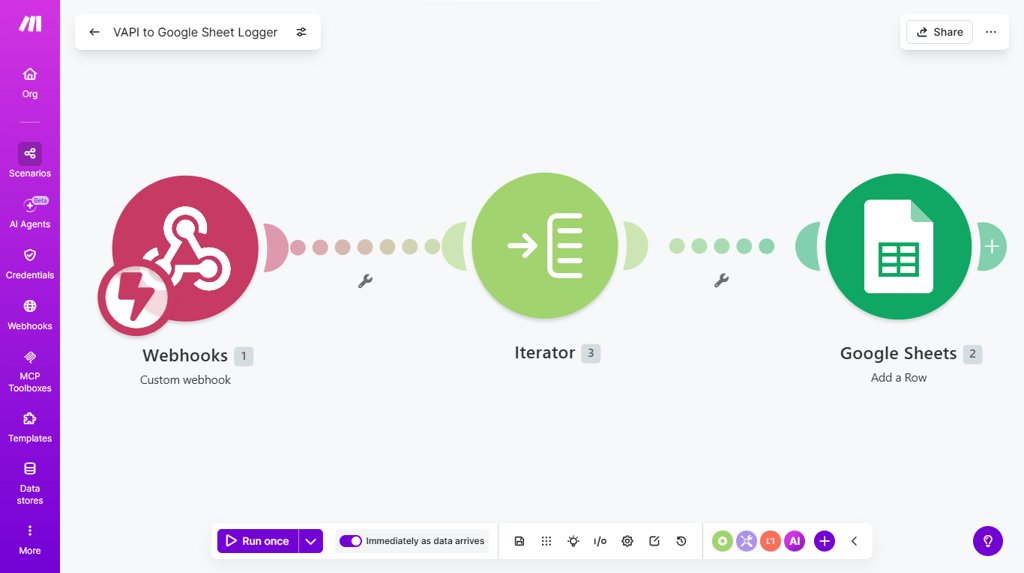
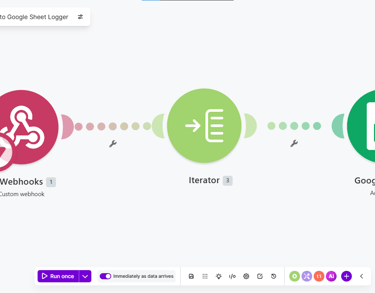
Real-Time API Data Pipeline (Voice AI to Database)
The Challenge: A client utilizing VAPI (Voice AI) needed to capture dynamic, unstructured data from phone calls and instantly route it into a structured database without manual data entry.
The Solution: I engineered an automated webhook pipeline using Make.com. The system listens for live API payloads, parses the JSON arrays using an Iterator, and perfectly maps the attributes into designated Google Sheets columns in real-time.
Zero Manual Entry: Completely eliminated human error and the need for manual data transcription.
Real-Time Scaling: The pipeline instantly processes incoming data, providing the client with a live, constantly updating database.
Business Value
Business Value
Data Engineering: Successfully extracted 4 years of trapped data, delivering a clean CSV perfectly formatted for financial modeling and trend analysis.
Scalability: The script automates pagination and pattern recognition, turning hours of manual data entry into a 10-second automated script.
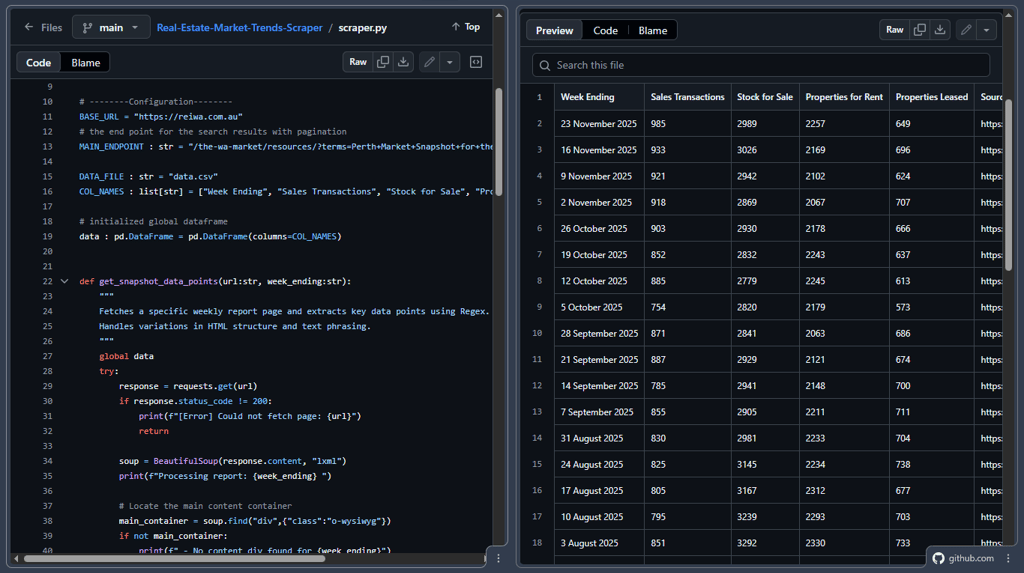
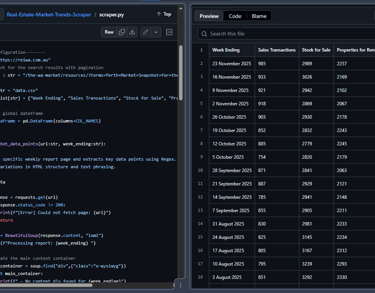
Real Estate Market Scraper (Python & Pandas)
The Challenge: A client required a complete 4-year historical dataset (2020-2024) of the Western Australia real estate market. The data was trapped in weekly, unstructured web reports with highly inconsistent HTML formats.
The Solution: I engineered a custom Python crawler using BeautifulSoup4 and advanced Regular Expressions (Regex) to bypass the inconsistent formatting. The raw text was then processed and structured into a clean Pandas DataFrame.
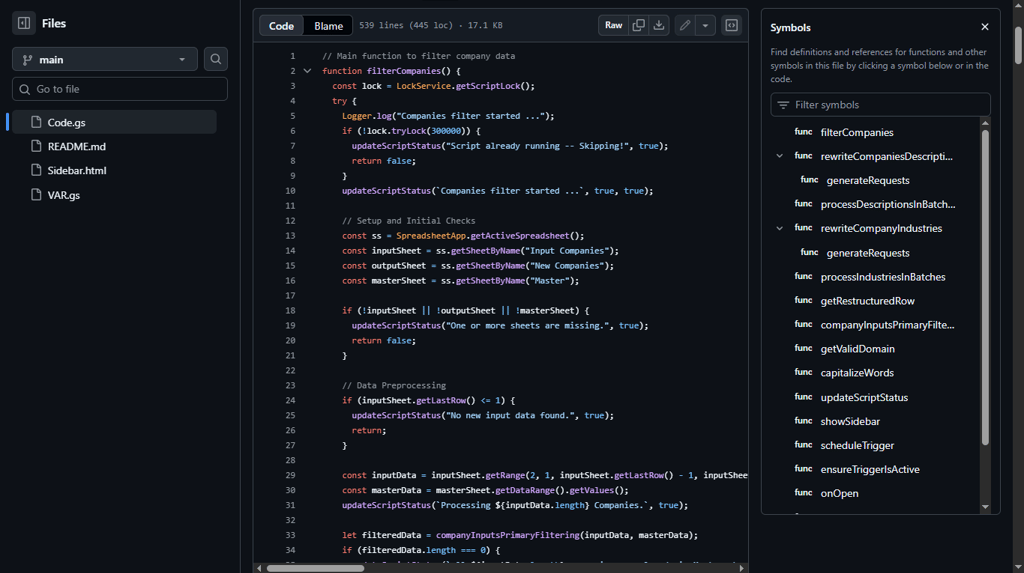
AI-Powered Corporate Data ETL Pipeline
The Challenge: A client needed to process over 5,000 company records daily. The raw data contained heavy duplicates, inconsistent naming conventions, and unstructured industry descriptions.
The Solution: I built an automated ETL (Extract, Transform, Load) pipeline directly inside Google Workspace using Apps Script. The system cross-references new data against a master archive to remove duplicates, and utilizes the OpenAI API to categorize and enrich the company descriptions.
Business Value
Enterprise-Grade Architecture: Implemented exponential backoff algorithms to bypass API rate limits, and concurrency locks to prevent race conditions.
Intelligent Automation: Eliminated manual data scrubbing, allowing the client to maintain a 100% clean, AI-enriched master database in real-time.